Open telemetry
OpenTelemetry is an open-source observability framework that provides a set of APIs, SDKs, and tools to instrument, generate, collect, and export telemetry data (such as metrics, logs, and traces). It helps developers gain deep visibility into their applications by standardizing how telemetry data is collected and transmitted to observability backends like Prometheus, Jaeger, Honeycomb, and others. OpenTelemetry is a vendor-neutral standard supported by the Cloud Native Computing Foundation (CNCF), making it a preferred choice for monitoring distributed systems and microservices.
SimpleIdServer can be easily configured to support OpenTelemetry. To get started, install the NuGet package:
dotnet add package SimpleIdServer.IdServer.OpenTelemetry
Then, update your Program.cs file by invoking the EnableOpenTelemetry() method from the fluent API. This method accepts two callbacks:
- One for configuring metrics
- One for configuring traces
EnableOpenTelemetry(m =>
{
    m.AddConsoleExporter();
    m.AddOtlpExporter(o =>
    {
        o.Endpoint = new Uri("");
        o.Headers = "";
        o.Protocol = OtlpExportProtocol.HttpProtobuf;
    });
}, t =>
{
    t.AddEntityFrameworkCoreInstrumentation(o =>
    {
        o.EnrichWithIDbCommand = (activity, command) =>
        {
            var stateDisplayName = $"{command.CommandType} main";
            activity.DisplayName = stateDisplayName;
            activity.SetTag("db.name", stateDisplayName);
            activity.SetTag("db.text", command.CommandText);
        };
    });
    t.AddConsoleExporter();
    t.AddOtlpExporter(o =>
    {
        o.Endpoint = new Uri("");
        o.Headers = "";
        o.Protocol = OtlpExportProtocol.HttpProtobuf;
    });
});
Default Instrumentation
By default, the following OpenTelemetry instruments are enabled:
- AddAspNetCoreInstrumentation: Monitors incoming HTTP requests to the Identity Server API.
- AddHttpClientInstrumentation: Monitors outgoing HTTP requests from the Identity Server to other APIs.
These provide valuable insights into both internal and external communication.
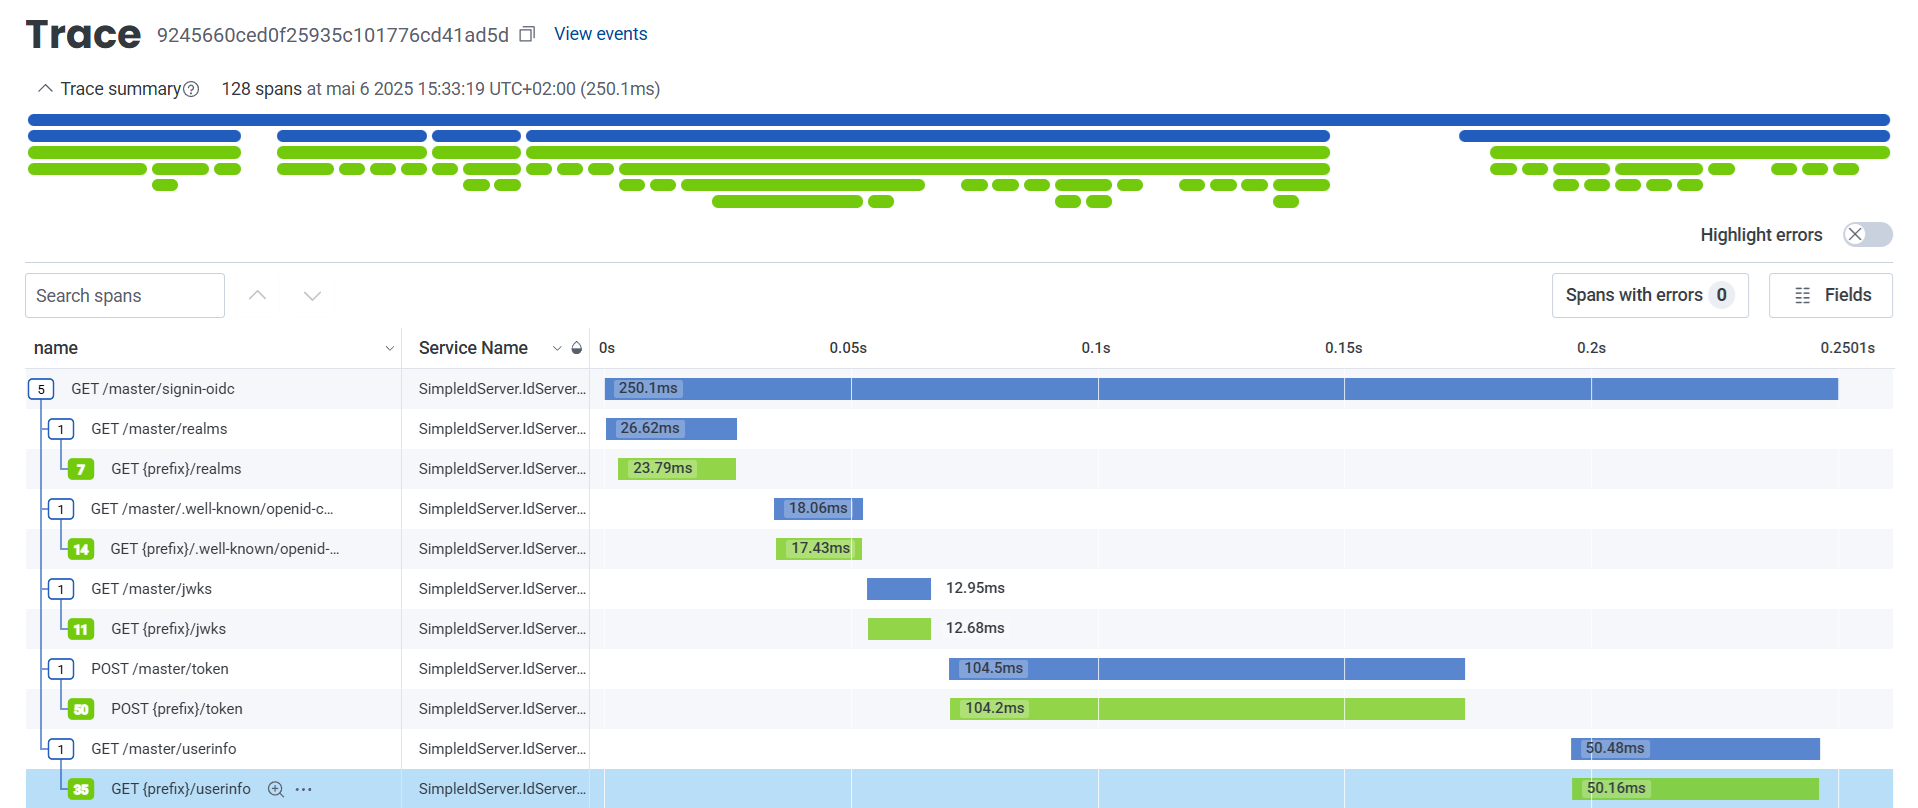
Built-in Trace Categories
The Identity Server defines three types of traces:
- Basic: Tracks internal logic processing, such as grant type handling.
- Store: Tracks operations involving database access, such as retrieving user data.
- Cache: Tracks operations interacting with the cache, like storing authorization codes.
All these trace categories are enabled by default but can be configured based on your needs.
Metrics Provided by the Identity Server
Here’s a summary of the built-in metrics you can monitor:
| Metric Name | Description | Tags |
|---|---|---|
user.count | Total number of users | — |
auth.requests.count | Total authentication requests | realm, client |
auth.success.count | Successful authentications | realm, client |
auth.failure.count | Failed authentications | realm, client |
logout.count | Logout events | realm |
consent.prompt.count | Consent prompts shown | realm, client |
consent.accepted.count | Consents accepted | realm, client |
consent.rejected.count | Consents rejected | realm, client |
token.issued.count | Tokens issued | realm, client, grant_type |
id_token.issued.count | ID tokens issued | realm, client, grant_type |
refresh_token.issued.count | Refresh tokens issued | realm, client, grant_type |
access_token.issued.count | Access tokens issued | realm, client, grant_type |
authorization_code.issued.count | Authorization codes issued | realm, client |
token.failed.count | Failed grant types | realm, client |
token.rejected.count | Rejected tokens | realm, client |
These metrics allow you to understand usage patterns, detect anomalies, and improve system reliability and performance.
Next Steps
To configure exporters and customize telemetry further, refer to the official .NET observability documentation. With just a few lines of code, you can start observing your Identity Server like never before—unlocking insights that help diagnose issues faster and optimize user experience.